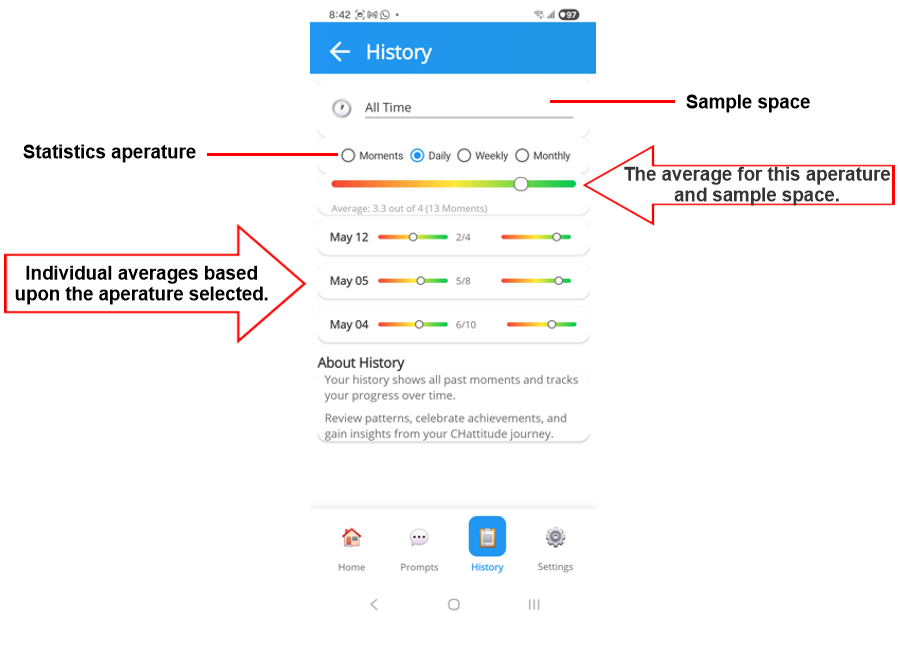
This History interface display statistical patterns based upon your aperature and sample space.
The Sample Space allows you to select from:
- All Time - all of your moments contained in data.
- Last 30 days.
- Last 3 months.
- Last 6 months.
- This Year.
The historic data and statistics will be based upon the data set that is selected in the Sample Space.
The Aperature determines the granularity of the data.
For example, if you select "Last 30 days" in the Sample Space, then you can select to view the data by "Day",
then the average of your moments for the past 30 days is calculated and displayed in the top graph.
Below this graph, the individual averages for each day in which your app was operating will be displayed with 2 graphs; one for the number of moments completed, and the second for the average score (4 representing the ideal).